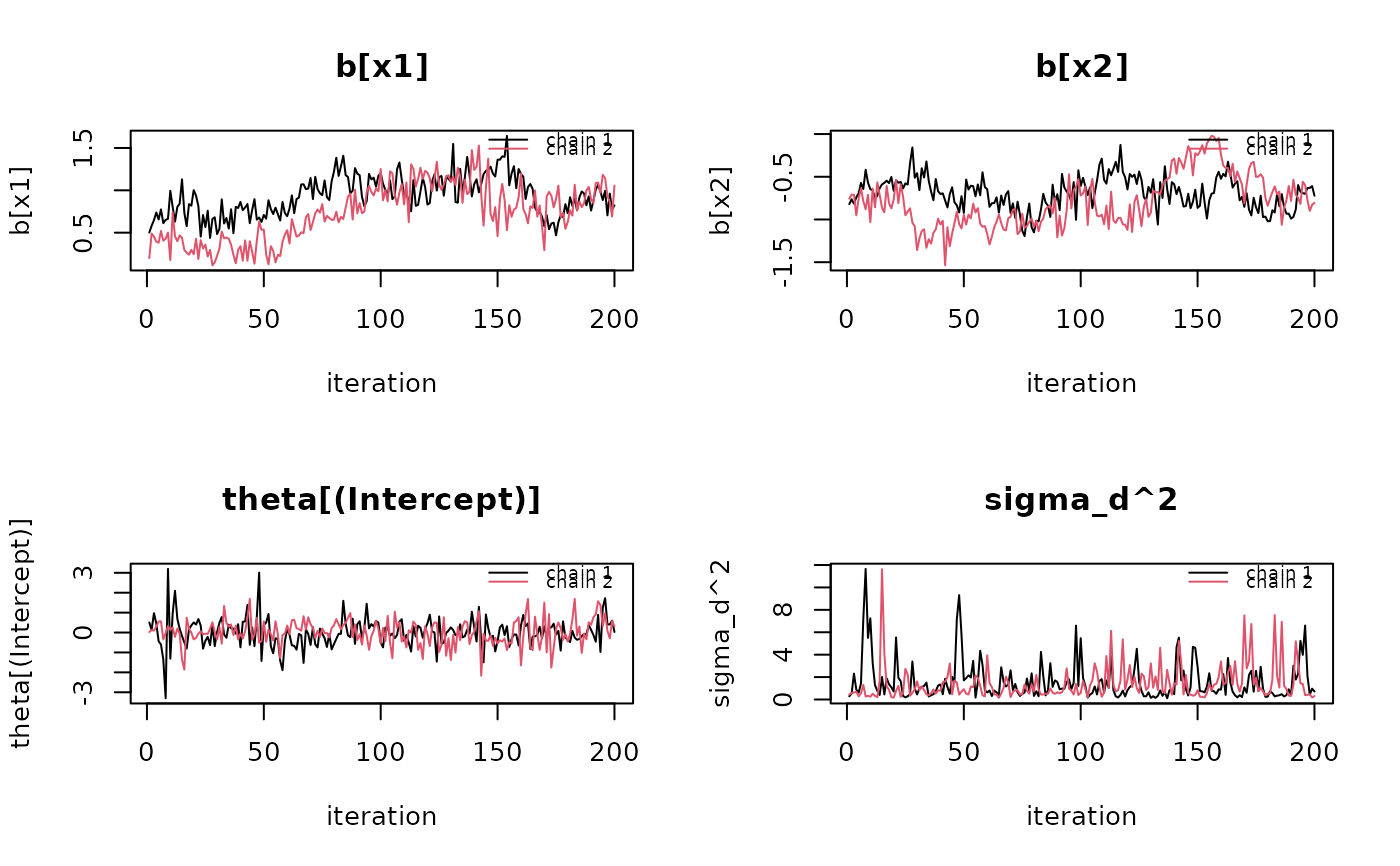
Overlaid per-chain traceplots (base graphics, no new dependency) for a
choicer_hmnl / choicer_hmnp fit's population coefficients (b), delta
mean-function coefficients (theta), alternative-effect variance
(sigma_d2), and, opt-in, a representative subset of the (potentially
~200-column) alternative effects (delta).
Arguments
- object
A
choicer_hmnlorchoicer_hmnpfit.- block
Character vector, any non-empty subset of
c("b", "theta", "sigma_d2", "delta")(HMNP fits additionally accept"sigma2", the raw non-identified shock-variance chain). Default plotsb,theta,sigma_d2(notdelta, which can have ~200 columns).- which
Only consulted when
"delta"is inblock.NULL(default) auto-selects a representative subset (the 3 highest rank-R-hat plus 3 lowest ESS_bulk alternatives, deduplicated, capped at 6). If supplied, a character vector of alternative labels or an integer vector of column indices.- ...
Additional arguments (ignored).
Examples
# \donttest{
sim <- simulate_hmnl_data(N = 60, T = 2, J = 4, seed = 1)
fit <- suppressWarnings(run_hmnlogit(sim$data, "task", "alt", "choice", c("x1", "x2"),
person_col = "pid",
mcmc = list(R = 300, burn = 100), chains = 2))
#> MCMC run time 0h:0m:0.02s
traceplot(fit)
 # }
# }